Volume 6 (2023) Issue 4 No.4 Pages 129-134
Abstract
Introduction: Cytokine release syndrome (CRS) is a life-threatening side effect of chimeric antigen receptor T (CAR-T) cell therapy. This study investigated whether serum inorganic phosphate (IP) and magnesium (Mg) levels are predictive markers of CRS development.
Methods: This single-center retrospective cohort study enrolled 16 consecutive patients with diffuse large B-cell lymphoma who had received CAR-T cell therapy. Logistic regression models with generalized estimating equations were used to evaluate whether changes in IP and Mg levels from their baseline values were associated with the development of CRS within 48 hours.
Results: Decreased IP and Mg levels from baseline (per 10% change) were associated with an increased CRS incidence (adjusted odds ratio 2.18 [95% confidence interval (CI), 1.31-3.62], 3.18 [95% CI, 1.57-6.44], respectively).
Conclusions: Changes in IP and Mg concentrations within 48 hours may be useful predictive markers of CRS onset.
Introduction
Anti-CD19 chimeric antigen receptor T (CAR-T) cell therapy has led to major advances in the treatment of relapsed/refractory (r/r) CD19-positive B-cell malignancies1,2. Although CAR-T cell therapy is effective, it can cause several adverse events, including cytokine release syndrome (CRS), immune effector cell-associated neurotoxicity syndrome, infection, cytopenia, and therapy-induced coagulopathy3. CRS, the most common side effect, results from the activation of a systemic inflammatory response by CAR-T cell therapy, and presents with high fever, hypotension, tachycardia, chills, and hypoxia2,4–6. Early interventions according to the severity grades of CRS7 are required without delay; otherwise, it would progress to a life-threatening condition.
Several factors involved in CRS mechanisms have been reported as possible predictors, including interleukin 6 (IL-6), C-reactive protein (CRP), prothrombin time (PT), activated partial thromboplastin time (aPTT), fibrinogen (Fibg), D-dimer, von Willebrand factor, and plasminogen activator inhibitor 1 (PAI-1)8–12, although their validity has not been fully established. Hypophosphatemia and hypomagnesemia have also been reported as treatment-related adverse events of CAR-T cell therapy13. Furthermore, declines in inorganic phosphate (IP) and magnesium (Mg) levels have been reported in cytokine storm events14, a pathology similar to CRS, suggesting that the systemic regulation of phosphate and magnesium may be involved in the mechanism of CRS onset. Indeed, a recent report has shown that IP levels decrease prior to the onset of CRS15, but whether IP or Mg can be predictive markers for CRS development requires further investigation. Thus, theoretically, they could be candidate markers for the detection of CRS onset.
The purpose of the present study was to clarify whether changes in IP and Mg levels from their baseline were associated with CRS in patients with r/r diffuse large B-cell lymphoma (DLBCL) treated with CAR-T cell therapy. We also describe the changes in other relevant markers that have been reported to be associated with CRS development over time.
Materials and Methods
Study design and patient selection
This was a retrospective cohort study conducted from January 1, 2021, to December 31, 2022. We enrolled 16 consecutive patients with r/r DLBCL who were treated with CAR-T cell therapy using tisagenlecleucel (Tisa-Cel, Kymriah, CTL019).
All enrolled patients underwent Tisa-Cel therapy in accordance with the Japanese pharmaceutical approval, which required conventional refractory DLBCL to receive at least two chemotherapy regimens or one regimen after autologous peripheral blood stem cell transplantation (PBSCT). We administered lymphocyte-depleting chemotherapy using either fludarabine and cyclophosphamide (Flu+CY) or bendamustine (Benda). Tisa-Cel was administered 1 to 2 days after the completion of chemotherapy. For severe CRS cases, tocilizumab (anti-IL-6 antibody) was administered according to the clinical consensus of the American Society for Transplantation and Cellular Therapy7.
Ethical approval
Informed consent was obtained from the patients with an opt-out policy, and the need for written informed consent was waived. The study protocol complied with the Declaration of Helsinki and was approved by the local ethics committee of our institution.
Data collection methods and measurement items
The following data were collected from electronic medical records: patient background (age, sex, primary disease, CRS onset, CRS grade, and treatment details) and laboratory findings (IP, Mg, CRP, white blood cell count, lymphocyte count, PT, aPTT, and Fibg). Information on each lot was provided by the pharmaceutical company (Novartis Pharmaceuticals Corporation): total viable cell number, total number of Tisa-Cel, and interferon-γ expression.
We defined the day of Tisa-Cel infusion as day 0 and followed the laboratory data up to day 14. These data were measured on-site using the following reagents: IP, L-type Wako IP (Fujifilm Wako Pure Chemicals Co., Ltd.); Mg, L-type Wako Mg (Fujifilm Wako Pure Chemicals Co., Ltd.); CRP, N-Assay LA CRP-T (Nittobo Medical Co., Ltd.); PT, Coagpia PT-Liquid (Sekisui Medical Co., Ltd.); aPTT, Thrombocheck APTT-SLA (Sysmex Corporation); Fibg, Coagpia Fbg (Sekisui Medical Co., Ltd.)
Time changes in IP and Mg after Tisa-Cel infusion and CRS development
The baseline values for IP and Mg were set as the values before Tisa-Cel administration (either just before lymphocyte-depleting chemotherapy or on the day of infusion), and the percentage change from baseline was calculated for each time point. The maximum percentage changes in IP and Mg within 48 hours of Tisa-Cel infusion were of primary interest.
The primary outcome was CRS occurrence. We diagnosed CRS and graded its severity according to the global consensus7. Grade 1 was defined as a persistent fever that did not improve despite the administration of antipyretics.
Statistical analysis
Patient characteristics are presented as median with range or interquartile range (IQR) for continuous variables and total number with percentage for categorical variables. Continuous variables were compared using the Mann-Whitney U test, and categorical variables were compared using the chi-square test. Changes over time are summarized as line plots for IP and Mg, as well as for other markers possibly associated with CRS. We estimated the adjusted odds ratio (aOR) for the development of CRS using multivariable logistic regression models with generalized estimating equations (GEE). Age and sex were included as adjusted variables in the model. All statistical analyses were performed using STATA (version 17.0; StataCorp, College Station, TX, USA).
Results
Patient characteristics
The patient characteristics are summarized in Table 1. A total of 16 r/r DLBCL patients infused with Tisa-Cel were enrolled. The median age of patients at infusion was 66.5 years (range, 48-75), and seven patients (44%) were male.
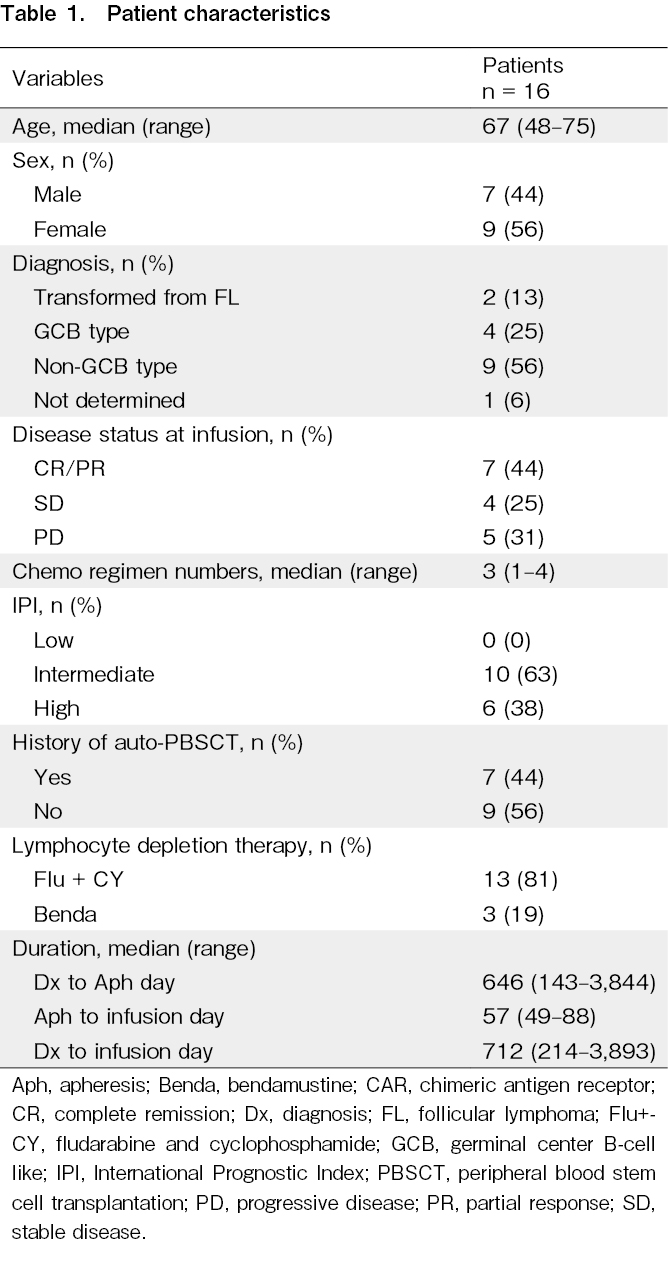
At the time of CAR-T cell infusion, the disease status was complete or partial response in seven patients, stable disease in four patients, and progressive disease in five patients. Forty-four percent of patients (n = 7) underwent autologous PBSCT before Tisa-Cel infusion. The median time from the initial diagnosis of DLBCL to Tisa-Cel infusion was 712 days (range, 214-3,893).
Clinical course
A summary of the characteristics of the Tisa-Cel-treated patients and their treatments is shown in Table 2. All Tisa-Cel data provided by the pharmaceutical company met the approved product criteria, and all cells were infused.
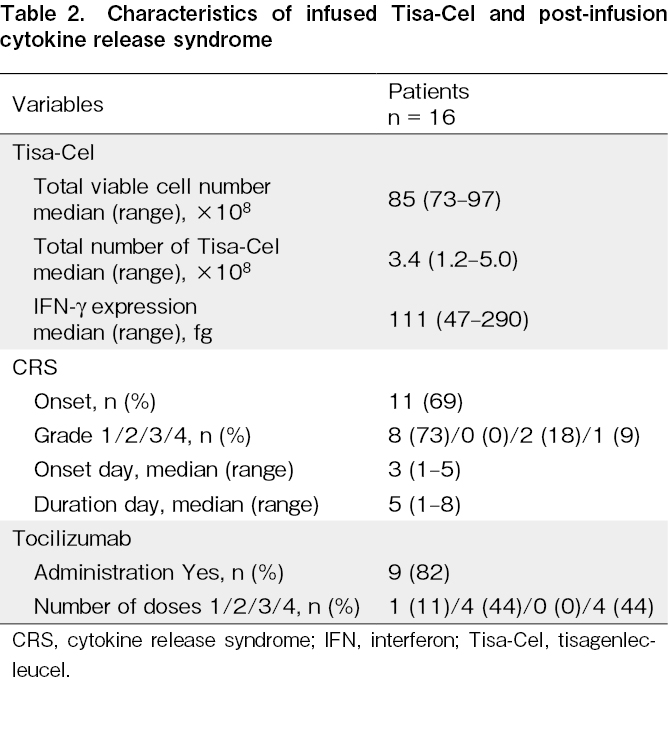
CRS developed in 11 of the 16 patients infused with Tisa-Cel. The severity at onset was grade 1 in 8 patients, grade 3 in 2, and grade 4 in 1. The median time to CRS onset was 3 days (range, 1-5) after Tisa-Cel infusion, and the median duration of CRS was 5 days (range, 1-8). Of the 11 patients with CRS, nine were administered tocilizumab (mostly two or four times). None of the patients required fresh frozen plasma or glucocorticoid treatment. No patient with CRS had obvious organ dysfunction, sepsis, or bacteremia during the course of the disease, but one patient developed SARS-CoV-2 infection.
Chronological changes in biomarkers other than IP and Mg are summarized in
Time changes in IP and Mg after Tisa-Cel infusion and CRS development
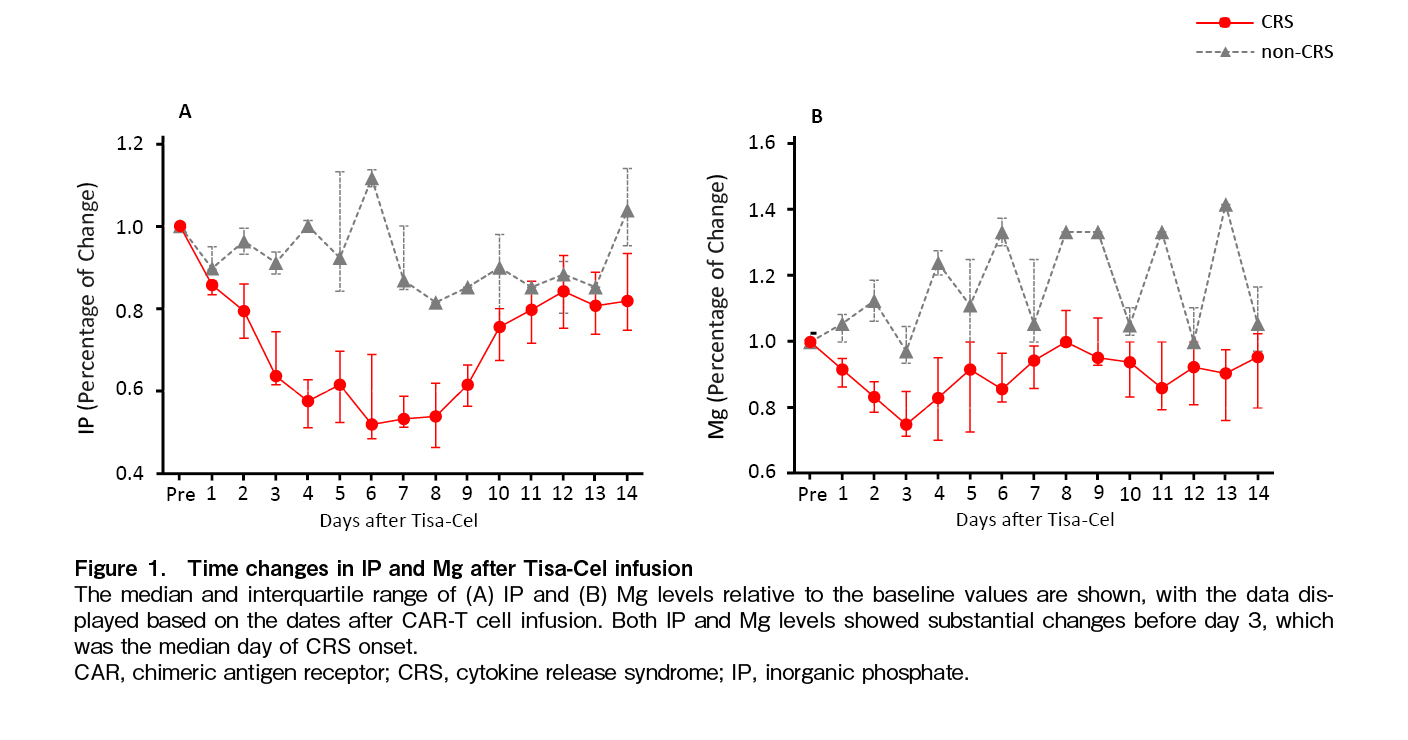
In the CRS group, IP levels decreased from day 2 after Tisa-Cel infusion, reached the lowest level around day 6, and then gradually recovered. The nadir level of IP against baseline was significantly lower in the CRS group than in the non-CRS group (0.79 [IQR, 0.73-0.81] vs. 0.96 [IQR, 0.93-0.99], p = 0.041). Only one patient with severe CRS received oral phosphorus supplementation on day 9 after Tisa-Cel infusion, and the IP levels returned to near baseline on day10 (Figure 1A). Furthermore, all patients whose IP levels decreased by 15% or more within 48 hours developed CRS, even when their IP levels were within the normal range (2.5-4.5 mg/dL).
In the CRS group, Mg levels decreased from the early stages of Tisa-Cel infusion, and the change of the values on day 2 were likely to be lower than in the non-CRS group (0.83 [IQR, 0.79-0.99] vs. 1.13 [IQR, 1.06-1.19], p = 0.080). Mg levels reached their nadir on day 3 and recovered to pre-infusion levels by day 8 (Figure 1B).
Multivariable logistic regression analyses showed that a decrease in IP from baseline was associated with CRS development (aOR 2.18 [95% confidence interval (CI), 1.31-3.62] in decrements of 10%). Similarly, changes in Mg levels were associated with CRS development (aOR 3.18 [95% CI 1.57-6.44] in decrements of 10%).
Discussion
In this study, we analyzed the changes in IP and Mg levels over time after CAR-T cell therapy and obtained the following findings; first, IP and Mg levels decreased during the early phase of Tisa-Cel infusion in patients with CRS, demonstrating that both are useful predictors of CRS development. A 10% decrease in IP and Mg levels from baseline within 48 hours raised the odds of CRS development by 2.18 and 3.18 times, respectively. Second, all the patients whose serum IP level decreased by 15% or more on day 2 after Tisa-Cel infusion developed CRS, even if their IP levels remained within the normal range.
Consistent with a previous report that revealed a significant decrease in IP levels preceding CRS onset15, we identified that serum IP levels may be a possible marker for predicting CRS development. In contrast to a previous report, we added the finding that a decrease in Mg levels could also predict CRS development. We adopted a study design with a comparison group and used the statistical method of a logistic regression model with GEE for repeated measurements within each individual. These methods may contribute to the detection of new findings, although statistical analysis using a small sample size carries the risk of erroneous conclusions by demonstrating apparent relationships. Furthermore, it is noteworthy that all patients developed CRS even if serum IP remained within the normal range but decreased by 15% or more from baseline. This new finding emphasizes the clinical importance of measuring changes from baseline rather than absolute values when monitoring IP levels after Tisa-Cel infusion.
Although evidence on the mechanism of CRS is limited, the pathophysiological understanding of the cytokine storm, which is considered to have a mechanism similar to that of CRS, provides a plausible explanation for our findings16. During COVID-19-related cytokine storms, a decrease in IP and Mg, which are required for the synthesis of adenosine triphosphate (ATP), leads to the depletion of intracellular ATP, resulting in excessive activation of the immune system. Therefore, a decrease in IP and Mg precedes the onset of cytokine storms, and consequent ATP depletion causes the development of cytokine storms14. In addition, it has been suggested that people with pre-existing conditions involving low ATP and energy storage are more likely to develop severe COVID-19 symptoms such as cytokine storms14, and some reports have demonstrated that ATP supplementation could prevent cytokine storms in specific populations with ATP deficiencies17. Assuming that the mechanism of CRS is comparable to that of COVID-19-related cytokine storms, the present findings that IP and Mg are possible markers of CRS development are reasonable.
This study demonstrated that IP and Mg levels decreased significantly 24-48 hours before CRS development, suggesting that measuring IP and Mg levels over time during CAR-T cell therapy will lead to early diagnosis and intervention in the early stages of CRS onset. Furthermore, because IP and Mg levels can be easily and inexpensively measured in routine in-hospital tests, we can readily adopt these tests in clinical practice at many facilities. Since CAR-T cell therapy has spread rapidly worldwide, the prediction of its life-threatening side effects by widely available tests is of great clinical importance.
We should recognize that there were several limitations in this study. First, this was a single-center study with a small sample size. We utilized statistical methods that accounted for repeated measurements within individuals and demonstrated results that were somewhat understandable based on clinical knowledge and experience. However, we should be cautious because we do not have sufficient knowledge of the mechanism by which changes in IP and Mg could be a possible marker for CRS onset. Furthermore, the small sample size and statistical analysis pose the risk of confounding biases, such as the apparent relationship between CRS onset and electrolyte disturbance. Hence, prospective studies with sufficient sample sizes are required before these results can be translated into clinical practice. Second, the timing of blood sampling was not controlled owing to the retrospective design. We defined primary exposure as a change in IP and Mg within 48 hours of CAR-T cell therapy, although CRS could develop during this period. This could lead to a lead-time bias or an inverted cause-effect relationship. However, we believe that this was less likely because the median duration of CRS onset was 3 days. Finally, there is an issue of generalizability. To interpret the results of this study, it is necessary to consider the characteristics of our institution. Our hospital is designated as a cancer care collaboration center by the Ministry of Health, Labor, and Welfare, and tends to have a higher proportion of referred patients with advanced stages of disease. Furthermore, the types of CAR-T products available in Japan are limited compared to those available overseas. Although there are slight differences in the mechanism of action compared with products used more widely overseas, CRS is a known adverse event associated with CAR-T cell therapy and is unlikely to affect the major conclusions of this study.
In conclusion, changes in IP and Mg levels from their baseline values are possible markers of CRS development after CAR-T cell therapy. The results of the present study emphasize that it is critical to monitor IP and Mg levels continuously when managing patients with r/r DLBCL undergoing CAR-T cell therapy.
Acknowledgments
We thank Mr. Yuta Torii, Ms. Yumi Shiroishi, and Mr. Hayato Maroka from the Department of Clinical Laboratory, Kobe City Medical Center General Hospital for their technical assistance.
Author Contributions
M.Y. initiated the trial, designed the study, and analyzed the data. M.Y. wrote the manuscript and Y.M. supervised the statistical analysis and manuscript writing, editing, and review.
S.M., N.Y., T.K., and T.I. collected data and provided patient information. J.K., T.K., and T.I. coordinated the project and edited the manuscript. All authors have read and approved the final manuscript.
Acknowledgments
We thank Mr. Yuta Torii, Ms. Yumi Shiroishi, and Mr. Hayato Maroka from the Department of Clinical Laboratory, Kobe City Medical Center General Hospital for their technical assistance.
Ethical Approval
The study protocol was approved by the ethics committee of Kobe City Medical Center General Hospital (approval number: zn221114).
Acknowledgments
We thank Mr. Yuta Torii, Ms. Yumi Shiroishi, and Mr. Hayato Maroka from the Department of Clinical Laboratory, Kobe City Medical Center General Hospital for their technical assistance.
Informed Consent
Informed consent was obtained from all individual participants included in the study using an opt-out approach. Participants were notified of the study and provided the opportunity to decline participation.
Acknowledgments
We thank Mr. Yuta Torii, Ms. Yumi Shiroishi, and Mr. Hayato Maroka from the Department of Clinical Laboratory, Kobe City Medical Center General Hospital for their technical assistance.
Data Sharing Statement
The data that support the findings of this study are available from the corresponding author upon reasonable request.
Conflicts of Interest
The authors declare no conflict of interest. Disclosure forms provided by the authors are available on the website.
References
1.Ali S, Kjeken R, Niederlaender C, Markey G, Saunders TS, Opsata M, et al. The European medicines agency review of Kymriah (Tisagenlecleucel) for the treatment of acute lymphoblastic leukemia and diffuse large B‐cell lymphoma. Oncologist. 2020; 25: e321-7.
2.Park JH, Rivière I, Gonen M, Wang X, Sénéchal B, Curran KJ, et al. Long-term follow-up of CD19 CAR therapy in acute lymphoblastic leukemia. N Engl J Med. 2018; 378: 449-59.
3.Yáñez L, Sánchez-Escamilla M, Perales MA. CAR T cell toxicity: Current management and future directions. Hemasphere. 2019; 3: e186.
4.Maude SL, Frey N, Shaw PA, Aplenc R, Barrett DM, Bunin NJ, et al. Chimeric antigen receptor T cells for sustained remissions in leukemia. N Engl J Med. 2014; 371: 1507-17.
5.Turtle CJ, Hanafi LA, Berger C, Gooley TA, Cherian S, Hudecek M, et al. CD19 CAR-T cells of defined CD4+: CD8+ composition in adult B cell ALL patients. J Clin Invest. 2016; 126: 2123-38.
6.Zahid A, Siegler EL, Kenderian SS. CART cell toxicities: new insight into mechanisms and management. Clin Hematol Int. 2020; 2: 149-55.
7.Lee DW, Santomasso BD, Locke FL, Ghobadi A, Turtle CJ, Brudno JN, et al. ASTCT consensus grading for cytokine release syndrome and neurologic toxicity associated with immune effector cells. Biol Blood Marrow Transplant. 2019; 25: 625-38.
8.Hay KA, Hanafi LA, Li D, Gust J, Liles WC, Wurfel MM, et al. Kinetics and biomarkers of severe cytokine release syndrome after CD19 chimeric antigen receptor-modified T-cell therapy. Blood. 2017; 130: 2295-306.
9.Yamasaki-Morita M, Arai Y, Ishihara T, Onishi T, Shimo H, Nakanishi K, et al. Relative hypercoagulation induced by suppressed fibrinolysis after tisagenlecleucel infusion in malignant lymphoma. Blood Adv. 2022; 6: 4216-23.
10.Xiao X, Huang S, Chen S, Wang Y, Sun Q, Xu X, et al. Mechanisms of cytokine release syndrome and neurotoxicity of CAR T-cell therapy and associated prevention and management strategies. J Exp Clin Cancer Res. 2021; 40: 367.
11.Hay KA, Hanafi LA, Li D, Gust J, Liles WC, Wurfel MM, et al. Kinetics and biomarkers of severe cytokine release syndrome after CD19 chimeric antigen receptor-modified T-cell therapy. Blood. 2017; 130: 2295-306.
12.Teachey DT, Lacey SF, Shaw PA, Melenhorst JJ, Maude SL, Frey N, et al. Identification of predictive biomarkers for cytokine release syndrome after chimeric antigen receptor T-cell therapy for acute lymphoblastic leukemia. Cancer Discov. 2016; 6: 664-79.
13.Schuster SJ, Tam CS, Borchmann P, Worel N, McGuirk JP, Holte H, et al. Long-term clinical outcomes of tisagenlecleucel in patients with relapsed or refractory aggressive B-cell lymphomas (JULIET): a multicentre, open-label, single-arm, phase 2 study. Lancet Oncol. 2021; 22: 1403-15.
14.van Kempen TA, Deixler E. SARS-CoV-2: influence of phosphate and magnesium, moderated by vitamin D, on energy (ATP) metabolism and on severity of COVID-19. Am J Physiol Endocrinol Metab. 2021; 320: E2-6.
15.Nakamura N, Arai Y, Kitawaki T, Jo T, Mizumoto C, Kanda J, et al. Decreased serum phosphate levels are a useful biomarker to predict occurrence and severity of cytokine release syndrome in chimeric antigen receptor T-cell therapy. Br J Haematol. 2023; 200: e1-3.
16.Shimabukuro-Vornhagen A, Gödel P, Subklewe M, Stemmler HJ, Schlößer HA, Schlaak M, et al. Cytokine release syndrome. J Immunother Cancer. 2018; 6: 56.
17.Taghizadeh-Hesary F, Akbari H. The powerful immune system against powerful COVID-19: A hypothesis. Med Hypotheses. 2020; 140: 109762.
Search
News