Volume 5 (2022) Issue 4 No.2 Pages 99-106
Abstract
We describe the allele and haplotype frequencies seen in a volunteer unrelated bone marrow donor registry, a public cord blood bank, and donor/recipient samples processed by the Health Sciences Authority (HSA) in Singapore. Historical human leukocyte antigen (HLA) typing reports were anonymized and combined. They were checked for HLA typing nomenclature discrepancies or ambiguities using the HLA-net UNIFORMATE tool, and for analysis, the validated data were subsequently separated into Chinese, Malay, Indian, and
Introduction
Tissue matching for hematopoietic progenitor cell transplantation is based upon human leukocyte antigens (HLAs) minimally matched at HLA-A, B, C, DR, and DQ, although other variables may be taken into consideration when assessing the suitability of a potential donor.
In 2018, of the 19,630 allogeneic transplants reported to the European Society for Blood and Marrow Transplantation (EBMT) Registry, 31.8% were from matched family donors, 16.2% were haploidentical related donors, 49.1% were from volunteer unrelated donors (VUDs), and 1.4% were from unrelated cord blood units (UCBs)1. In the Asia-Pacific region, of the 17,572 allogeneic transplants performed in 2015, 37.8% were from related donors, 16.1% were from VUDs, and 8.6% were from UCBs2. Currently, the total number of donors and cords potentially available in the World Marrow Donor Association (WMDA) database is approximately 38,008,2913. In 2014, the National Marrow Donor Program (NMDP) demonstrated that approximately 75% of patients of European descent are likely to identify an 8/8 HLA-matched VUD; however, the rate is considerably lower for recipients of non-European descent, consistent with the observed lower VUD utilization within the Asia-Pacific region. This difference may be associated with the lower representation and poorer availability of VUDs from these populations in the worldwide VUD pool4, 5.
The Singapore population is largely derived from migrant populations who have settled over the past two centuries6. The
With the integration of different population gene pools over the decades, we believe that the Singapore population has unique HLA characteristics that hitherto have not been systematically described.
We herein describe the HLA allele and haplotype frequencies amongst UCBs and adult VUDs in Singapore. This information will potentially contribute to optimizing the size and ethnic composition of the donor pool and improve the probability of finding local donors for local patients8–13.
Materials and Methods
In this descriptive study, we utilized historical de-identified and unlinked HLA typing data that had accrued in the period between January 1st 2005 and June 1st 2020 from healthy VUDs recruited by the Bone Marrow Donor Programme (BMDP), cord blood units collected by Singapore Cord Blood Bank (SCBB), and recipient/donor samples processed by the Health Sciences Authority (HSA).
During the accrual period, the BMDP and SCBB study populations were typed at high resolution based on next-generation sequencing.
The HSA study population was genotyped up to the second-nomenclature field with sequence-specific primers using One Lambda Micro SSP Allele Specific Trays and sequence-based typing (SBT) using Secore SBT, targeting exons 2 to 4 for Class I and exons 2 to 3 for Class II. Using the available family data, the haplotypes were deduced by comparing the group of HLA alleles inherited from each parent. Only families with four haplotypes were included.
The VUD pool comprised approximately 70,000 individuals, with approximately 77% identified as
HLA typing data and ethnicity of the VUD/UCB were exported from the respective databases. These data were unlinked and contained no identifiers, and thus there was no likelihood of identifying individuals. High-resolution results were obtained from 59,186 individuals.
Calculations of the top allele frequencies for each of the five alleles for each of the Chinese, Malay, Indian and Other populations were performed using a customized script.
HLA typing data from BMDP, SCBB, and HSA were combined and checked for discrepancies or ambiguities in HLA typing nomenclature using the HLA-net UNIFORMATE tool (
The five-locus data (HLA-A, HLA-B, HLA-C, HLA-DRB1, and HLA-DQB1) were converted into a valid UNIFORMAT file format14. Individual ethnic allele and haplotype frequencies were calculated by uploading the UNIFORMAT file onto the HLA-net GENE[RATE] pipeline15 using the Basic Statistics Tool (
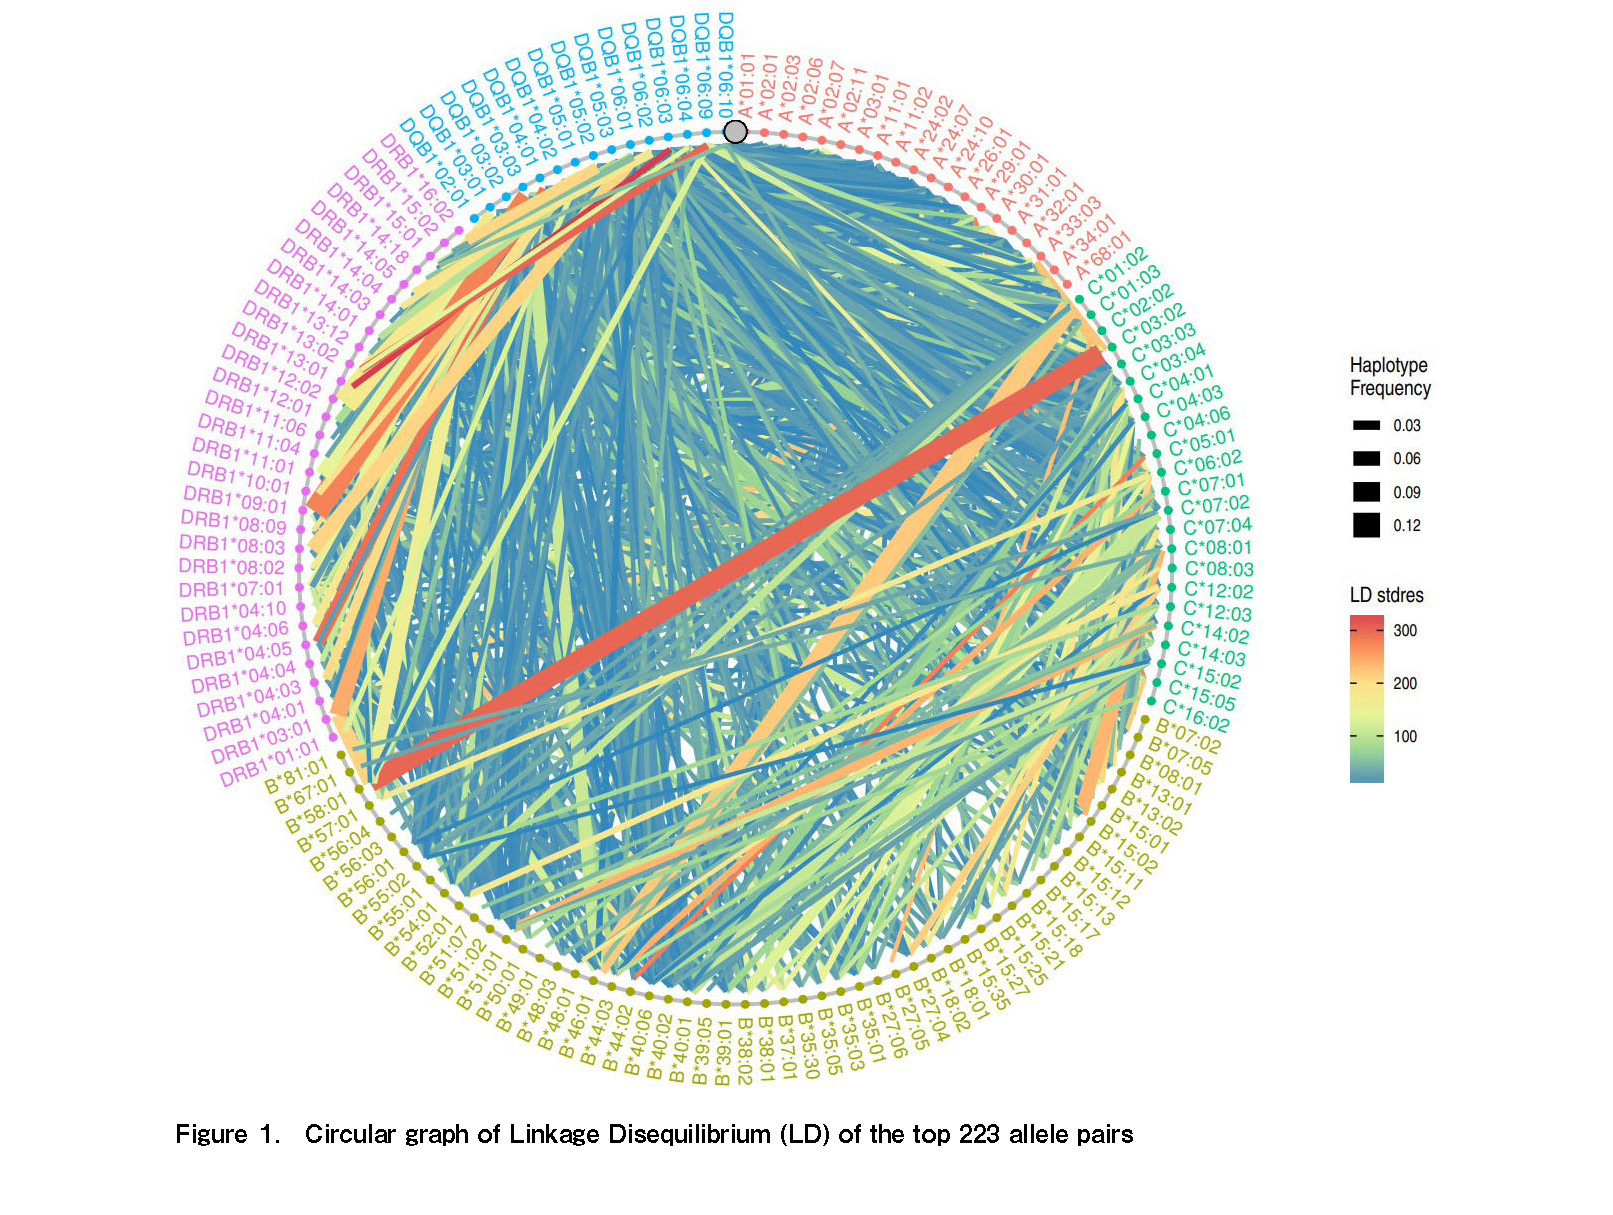
A circular graph (Figure 1) showing the linkage disequilibrium (LD) between the top 223 observed alleles was downloaded as part of the output from HLA-net. The thickness of the linkage represents the observed haplotype frequencies between two alleles. The color of the linkages denotes the standard residual of the LD, which measures the difference between the observed and expected linkage frequency using the chi-square test.
Haplotypes that had estimated frequencies of less than 0.01% were excluded when determining the N value for the total population and for each CMIO population.
To validate whether the estimated haplotype frequencies obtained from HLA-net were similar to those observed in the actual population, 676 known haplotypes from donors and patients were used for comparison. The top 20 haplotypes by frequency from the entire HLA cohort were tabulated and compared with the donor and patient haplotype frequencies (
The top 20 HLA alleles and haplotype frequencies that best represented each of the CMIO populations were selected. A heatmap was generated using the ggplot package16 in Rstudio17. Hierarchical clustering of the alleles and haplotypes was performed using the hclust package18 with the
Results
HLA typing results from a total of 59,186 individuals and cord blood units previously typed at high resolution at the HLA-A, HLA-B, HLA-C and HLA-DRB1 and HLA-DQB1 loci were included in the analysis.
HLA Allele Frequencies: Class I and Class II
The most common HLA class I alleles were HLA-A*11:01 (overall 25.2% and in 28.27%, 18.04%, and 15.51% in the Chinese, Malay, and Other populations, respectively). The commonest HLA-A allele in the Indian population was HLA-A*24:02 at a frequency of 16.59%. Figure 2 shows a visualization of the top 20 HLA-A, -C, -B, -DRB1, -DQB1 allele sharing patterns within the CMIO populations.
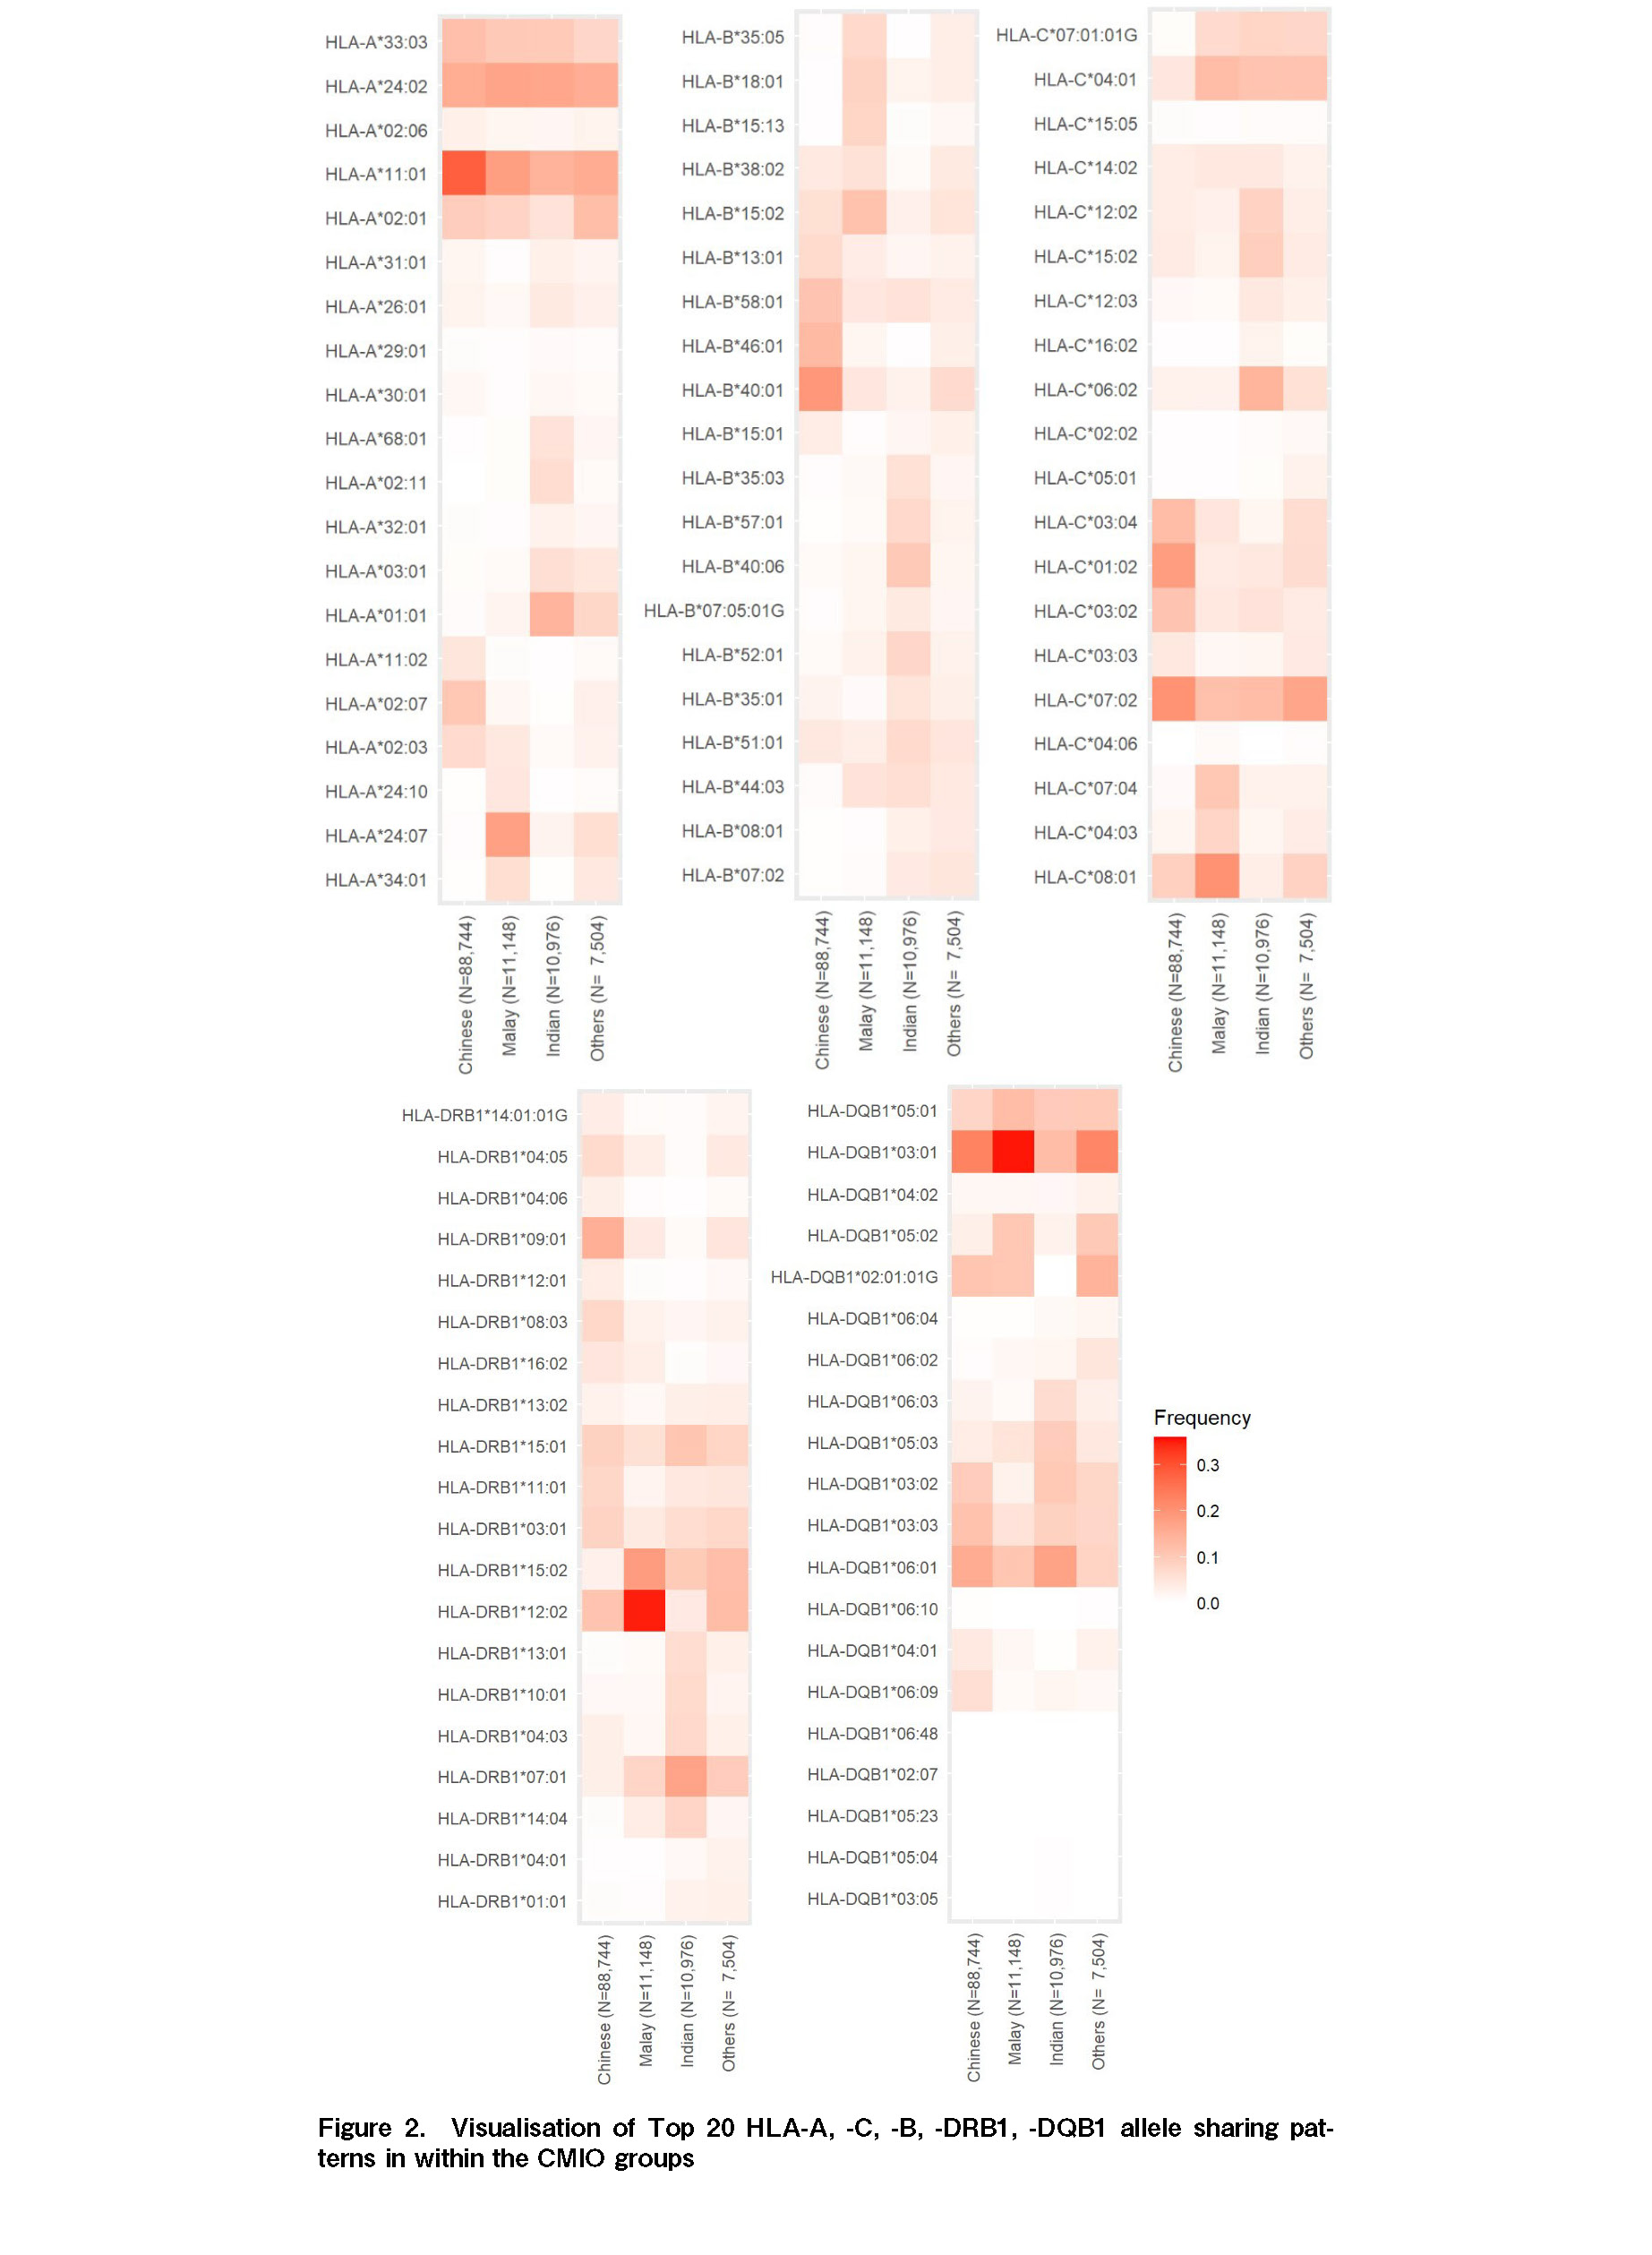
In terms of HLA-B, across the entire population, HLA-B*40:01 was the most frequent at 15.44%. HLA-B*40:01 was the most frequent in the Chinese and Other populations at 19.16% and 6.73% respectively, whereas HLA-B*15:02 was most frequent in the Malay population at 11.48%, and HLA-B*40:06 was most frequently detected in the Indian population at 10.08%.
Among HLA-C alleles, HLA-C*07:02 was the most frequently detected overall at 18.29%, and at 19.96% and 6.74% in the Chinese and Other populations, respectively. In the Malay population, HLA-C*08:01 was the most frequent at 20.08%, and in the Indian population, HLA-C*06:02 was the most frequent at 13.96%.
The most frequent class II allele was HLA-DRB1*12:02 at 34.93% in the Malay population, 14.96% in the Chinese population, and 12.62% in Others. Amongst Indians, the most frequent HLA-DRB1 allele was HLA-DRB1*07:01 at 17.06%. In the entire population HLA-DRB1*12:02 was most frequently detected at 12.79%.
With respect to HLA-DQB1, HLA-DQB1*03:01 was the most frequently encountered across the entire population at 23.02%, with respective frequencies of 22.88%, 35.36%, and 22.01% in Chinese, Malay, and Other populations. Amongst Indians, HLA-DQB1*06:01 was most frequent at 17.25%.
HLA Haplotype Frequencies
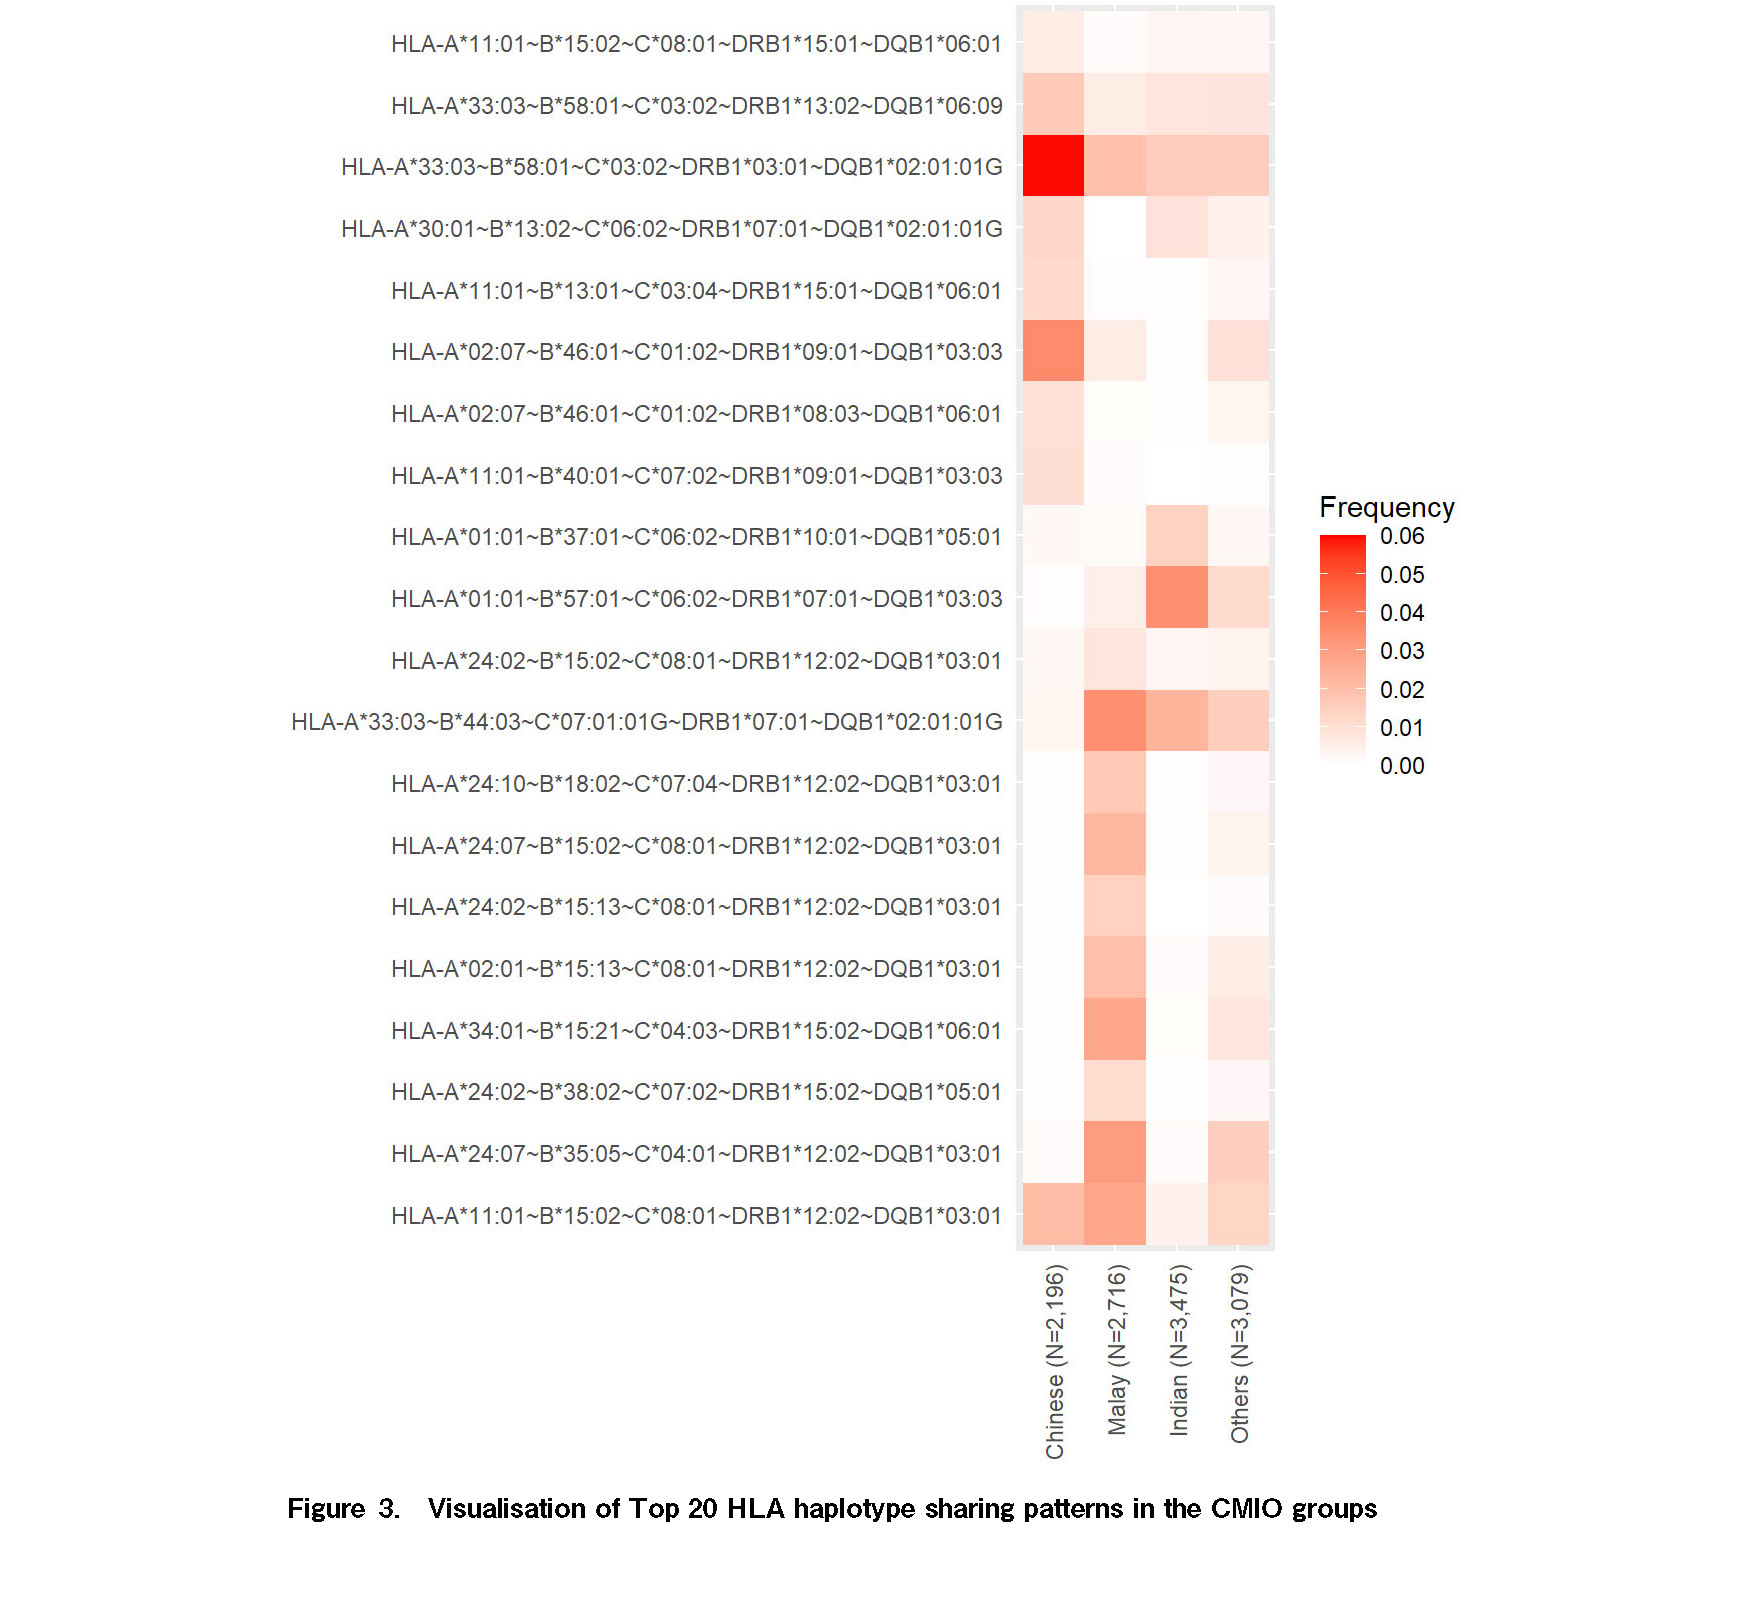
The HLA-net GENE[RATE] pipeline generated estimated haplotypes and frequencies for the entire study (N = 2,470), Chinese (N = 2,196), Malay (N = 2,716), Indian (N = 3,475), and Other (N = 3,079) populations.
The B*58:01 and C*03:02 allele pairs were identified as having the highest frequencies, with the largest LD standard residuals among all 223 allele pairs. We also observed that the DRB1 and DQB1 allele pairs had moderate LD. Most of the other allele pairs showed smaller LD values.
Within the studied population, the haplotype HLA-A*33:03~B*58:01~C*03:02~DRB1*03:01~DQB1*02:01:01G was the most commonly observed, with a frequency of 4.91%. This was also the most common haplotype amongst the Singapore Chinese donors (5.97%). This haplotype is the second most common haplotype amongst the Zhejiang Han population19 and is frequently seen in the US National Marrow Donor Programme Registry (NMDP): Chinese (4.6%), Vietnamese Kinh (4.5%) and US NMDP (3.6%)20.
Consistent with the predominant Chinese population, haplotypes with a frequency greater than 1% were also the most frequently observed haplotypes in the Singapore population. Interestingly, the haplotype most commonly seen in the Chinese population is the seventh most commonly seen haplotype in the Malay population and the third most common haplotype in Others.
Amongst the Malay donor population, the most common haplotype was HLA-A*33:03~B*44:03~C*07:01:01G~DRB1*07:01~DQB1*02:01:01G, with a frequency of 3.41%. This haplotype is also seen in South Korean (3%), US NMDP South Asian Indian (2.8%), Vietnamese Kinh (2.8%), and US NMDP Korean (2.6%) populations20. The second most common haplotype seen amongst the Malays is the fourth most common haplotype seen in
Within the Indian donor population, the most common haplotype is HLA-A*01:01~B*57:01~C*06:02~DRB1*07:01~DQB1*03:03 with a frequency of 3.42%. This haplotype is seen in Tunisian (9%), India Tamil Nadu (3.6%), Brazil Puyanawa (3.3%), Malaysia Peninsular Indian (3.3%) and US NMDP South Asian Indian (2.2%) population20.
Comparisons of the estimated haplotype frequencies and the known haplotypes reveal a reasonably good concordance between the top 20 haplotypes for the entire CMIO and the Chinese cohort (
Amongst those who classify themselves as
Table 1 presents a comparison of the frequency distribution of the top 20 most common haplotypes across the categorized racial groups, and Figure 3 shows a heatmap visualization of these haplotypes.

Discussion
To the best of our knowledge, this is the first report describing the high-resolution HLA allele and haplotype frequencies detected at five loci within a volunteer adult hematopoietic stem cell donor pool and cord blood units in Singapore, based on data obtained from approximately 60,000 donors.
Compared with a previous study published in 2005, which reported the HLA allele and haplotype frequencies of 536 Chinese VUDs from the BMDP and 174 mothers and their UCBs from the SCBB, the top three haplotypes in the Chinese population remain HLA-A*33:03~B*58:01~C*03:02~DRB1*03:01~DQB1*02:01:01G, currently at 5.97%; HLA-A*02:07~B*46:01~C*01:02~DRB1*09:01~DQB1*03:03, currently at 3.57%; and HLA-A*11:01~B*15:02~C*08:01~DRB1*12:02~DQB1*03:01,currently at 2.05%. However, this study was limited to HLA-A, B, C and DRB1 and the study population from SCBB was not selected for ethnicity21. Given the small sample size in the 2005 study, comparison of the data for other population groups would be of limited validity.
The four population groups assessed in the present study were found to have a number of frequently occurring haplotypes in common, thereby indicating either an admixing of the gene pool over time across the populations or a suboptimal classification system.
The Chinese-Malay-Indian-Others (CMIO) model is the most commonly used descriptive framework for ethnicity in Singapore. In Singapore. genetic distances due to the ethnic mixtures are indistinctly defined, as ethnic identification generally follows paternal ethnicity. For example, the
A notable limitation of this study is that we restricted our study population to donor pools and hence this may not provide a true reflection of the country's population as a whole, given the disparity between the composition of ethnic population of the donor pools and that of the general population.
Currently, potential transplant recipients from the Malay and Indian communities experience particular challenges with respect to the availability of suitable VUDS and UCBs, which can be attributed to an under-representation of their haplotypes in local donor pools and accredited international registries. Although advances in transplant technology have resulted in a significant increase in the utilization of related haploidentical donors in hematopoietic stem cell transplantation, the evolving family demographics suggest that VUDs and UCBs will remain an important option for potential hematopoietic progenitor cell transplant recipients.
In order to develop donor pools that match the requirements of the population, it will be necessary assemble donor pools with a broader haplotype diversity composition to provide the basic HLA data required for the targeted recruitment of donors, and thereby support the hematopoietic stem cell donor requirements of the population.
Author Contributions
ANYJ performed the statistical and haplotype analyses. All other authors contributed anonymized data and participated in the preparation and approval of the manuscript.
Ethical Approval
Studies involving the analysis of unidentifiable data did not require a review by our institutional review board. Informed consent was not required for the same reason.
Conflict of Interest
The authors declare no conflict of interest. Disclosure forms provided by the authors are available on the website.
References
1. Passweg JR, Baldomero H, Chabannon C, Basak GW, Corbacioglu S, Duarte R, et al. The EBMT activity survey on hematopoietic-cell transplantation and cellular therapy 2018: CAR-T's come into focus. Bone Marrow Transplant. 2020; 55: 1604-13.
2. Iida M, Kodera Y, Dodds A, Ho AYL, Nivison-Smith I, Akter MR, et al. Advances in hematopoietic stem cell transplantation in the Asia-Pacific region: the second report from APBMT 2005-2015. Bone Marrow Transplant. 2019; 54: 1973-86.
3.WMDA.
4. Gragert L, Eapen M, Williams E, Freeman J, Spellman S, Baitty R, et al. HLA match likelihoods for hematopoietic stem-cell grafts in the U.S. registry. N Engl J Med. 2014; 371: 339-48.
5. Evseeva I, Foeken L, Madrigal A. The Role of Unrelated Donor Registries in HSCT. In: Carreras E, Dufour C, Mohty M, Kroger N, Editors. The EBMT Handbook: Hematopoietic Stem Cell Transplantation and Cellular Therapies, 7th edition. Springer, 2019; p.19-20
6. Swee-Hock S. Population Trends in Singapore, 1819-1967. Journal of Southeast Asian History. 1969; 10: 36-49.
7.Population and Population Structure, M810011 – Singapore Residents By Age Group, Ethnic Group And Sex, End June, Annual. Singapore Department of Statistics; 2020.
8. Halagan M, Manor S, Shriki N, Yaniv I, Zisser B, Madbouly A, et al. East Meets West-Impact of Ethnicity on Donor Match Rates in the Ezer Mizion Bone Marrow Donor Registry. Biol Blood Marrow Transplant. 2017; 23: 1381-6.
9. DiLabio J, Doyle J, Alexander S, Gupta S, Punnett A. Impact of Ethnicity on Donor Search Results for Children Requiring Stem Cell Transplantation. J Pediatr Hematol Oncol. 2015; 37: e154-7.
10. Lown RN, Marsh SG, Switzer GE, Latham KA, Madrigal JA, Shaw BE. Ethnicity, length of time on the register and sex predict donor availability at the confirmatory typing stage. Bone Marrow Transplant. 2014; 49: 525-31.
11. Pidala J, Kim J, Schell M, Lee SJ, Hillgruber R, Nye V, et al. Race/ethnicity affects the probability of finding an HLA-A, -B, -C and -DRB1 allele-matched unrelated donor and likelihood of subsequent transplant utilization. Bone Marrow Transplant. 2013; 48: 346-50.
12. Schmidt AH, Solloch UV, Baier D, Stahr A, Wassmuth R, Ehninger G, et al. Regional differences in HLA antigen and haplotype frequency distributions in Germany and their relevance to the optimization of hematopoietic stem cell donor recruitment. Tissue Antigens. 2010; 76: 362-79.
13. Nishiwaki S, Tanaka H, Kojima H, Okamoto S. Availability of HLA-allele-matched unrelated donors: estimation from haplotype frequency in the Japanese population. Bone Marrow Transplant. 2019; 54: 300-3.
14. Nunes JM. Using uniformat and gene[rate] to Analyze Data with Ambiguities in Population Genetics. Evol Bioinform Online. 2016; 11: 19-26.
15. Nunes JM, Buhler S, Roessli D, Sanchez-Mazas A; HLA-net 2013 collaboration. The HLA-net GENE[RATE] pipeline for effective HLA data analysis and its application to 145 population samples from Europe and neighbouring areas. Tissue Antigens. 2014; 83: 307-23.
16. Wickham H. Ggplot2: Elegant Graphics for Data Analysis,
17.RT. RStudio: Integrated Development for R. RStudio, PBC. Published 2020.
18. Müllner D. fastcluster: Fast Hierarchical, Agglomerative Clustering Routines for R and Python. J of Stat Softwa. 2013; 53: 1-18.
19. Chen N, Wang W, Wang F, Dong L, Zhao S, Zhang W, et al. The distributions of HLA-A, HLA-B, HLA-C, HLA-DRB1 and HLA-DQB1 allele and haplotype at high-resolution level in Zhejiang Han population of China. Int J Immunogenet. 2019; 46: 7-16.
20. Gonzalez-Galarza FF, McCabe A, Santos EJMD, Jones J, Takeshita L, Ortega-Rivera ND, et al. Allele frequency net database (AFND) 2020 update: gold-standard data classification, open access genotype data and new query tools. Nucleic Acids Res. 2020; 48: D783-8.
21. Tang TF, Hou L, Chen M, Belle I, Mack S, Lancaster A, et al. HLA haplotypes in Singapore: a study of mothers and their cord blood units. Hum Immunol. 2007; 68: 430-8.
Search
News